David Lappi is a geologist from Alaska who has sent in a set of beautiful graphs–including an especially prosaic one of the last 10,000 years in Greenland–that he put together himself (and which I’ve copied here at the top).If you wonder where today’s temperature fits in with the grand scheme of time on Earth since the dinosaurs were wiped out, here’s the history. We start with the whole 65 million years, then zoom in, and zoom in again to the last 12,000 from both ends of the world. What’s obvious is that in terms of homo sapiens history, things are warm now (because we’re not in an ice age). But, in terms of homo sapiens civilization, things are cooler than usual, and appear to be cooling.Then again, since T-rex & Co. vanished, it’s been one long slide down the thermometer, and our current “record heatwave” is far cooler than normal. The dinosaurs would have scoffed at us: “What? You think this is warm?”With so much volatility in the graphs, anyone could play “pick a trend” and depending on which dot you start from, you can get any trend you want. — Jo
Go to the post for David Lappi's piece, but here is the graph of the last 65 million years:

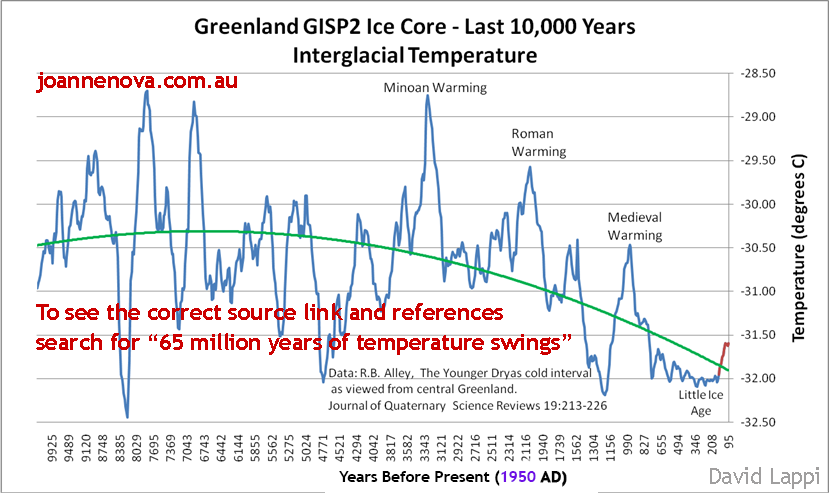
Then there is graph of the last 10,000 years (which is basically the present interglacial period since the end of the last ice age). Look at the big picture and global warming disappears and is replaced by long term cooling (and that is very worrying):
In fact, it appears that there has been an overall cooling trend now for 5 million years:

No comments:
Post a Comment